Agent Sandbox console helps you view and manage sandboxes, templates, and usage statistics.
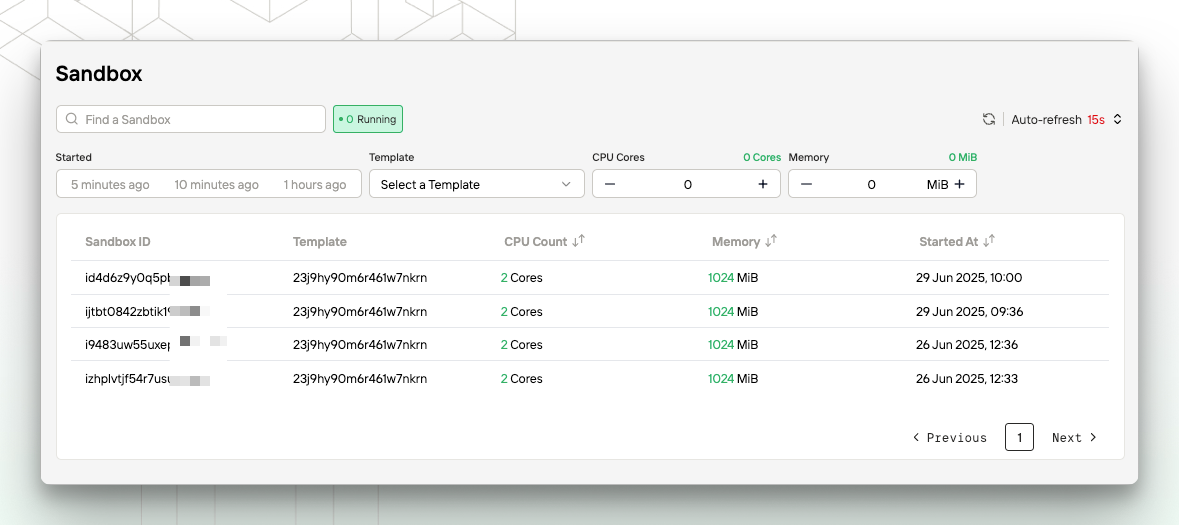
Sandbox Management
- Display the list of currently running sandboxes.
- Support searching for a sandbox by ID.
- Support filtering sandboxes by creation time, template, vCPUs, memory, etc.
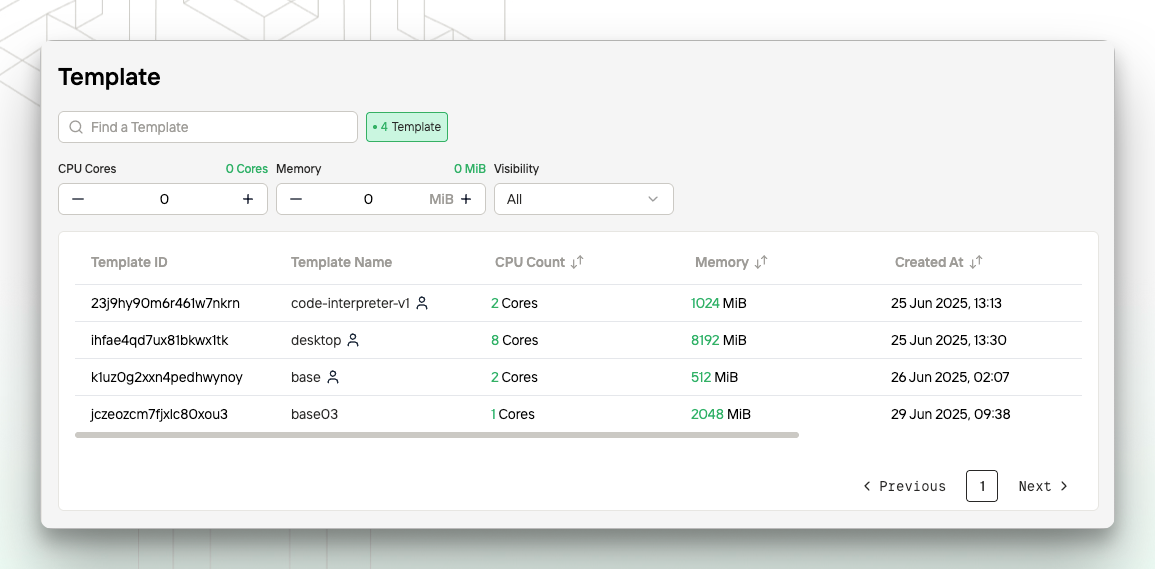
Template Management
- Display the list of available templates, including official templates provided by Novita official and your custom templates.
- Support searching for a template by ID.
- Support filtering templates by visibility (public, private, or all), vCPUs, and memory.
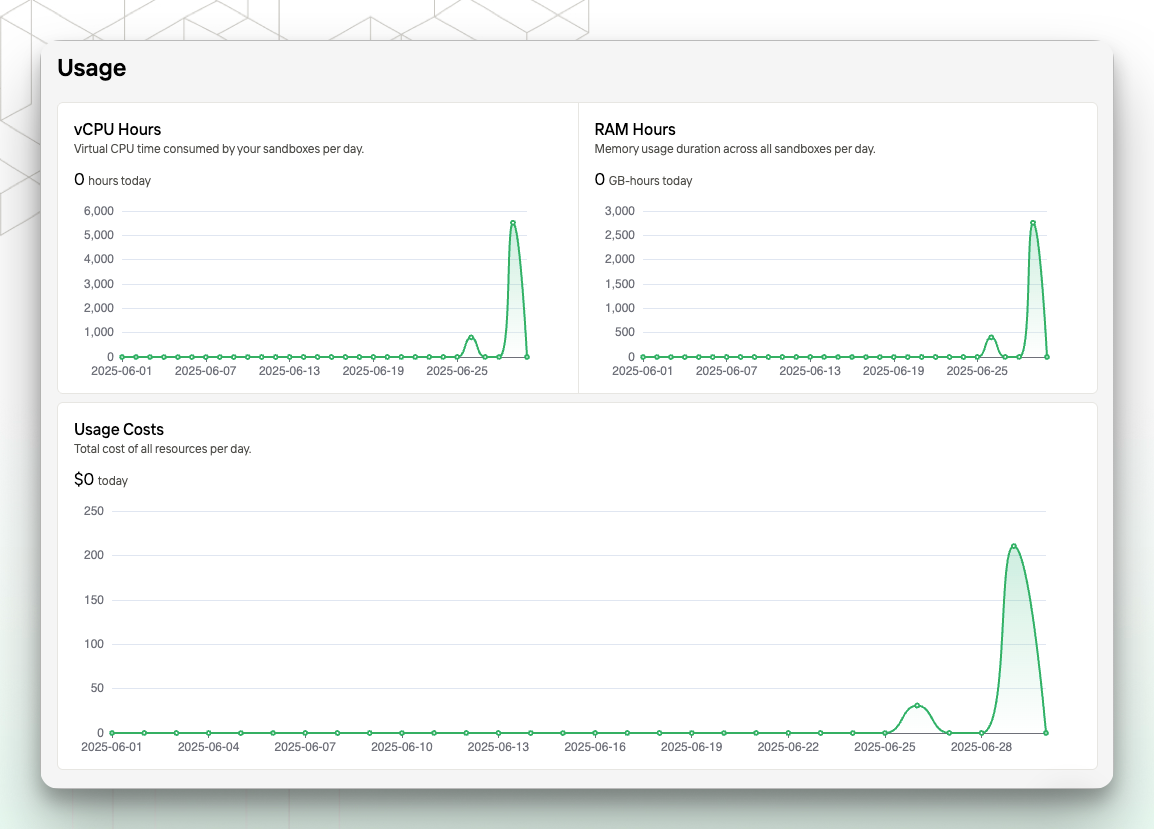
Usage Statistics
The console provides daily resource usage and cost analysis to help you monitor and optimize your consumption.
-
vCPU Hours
- Displays the total vCPU runtime across all sandboxes for the current day (unit: hours).
- This data is calculated with second-level precision and can help you evaluate compute usage.
-
Memory Hours
- Displays the total memory usage across all sandboxes for the current day (unit: GB·hours).
- The system calculates this based on each sandbox’s allocated memory and runtime.
-
Usage Costs
- Displays the total resource cost for the current day (unit: USD).
- This includes vCPU and memory costs. For detailed billing rules, see Pricing.
- All resources are billed by the second and displayed at daily granularity.
- The chart shows usage trends over the past 30 days and can be used to monitor changes in resource consumption.
- This data may not include the most recent usage and may differ slightly from your final bill. Final charges are based on the Billing Details page.
Last modified on June 25, 2026